When analyzing situations in which there are two or more variables, each of which has an impact on the end result being measured (here, the ORP), analysts use the technique of changing only one variable at a time, while treating the others as Maintain a constant value to see how this variable alone affects the result.
In this way, the individual effect that each variable has on the result can be observed. In our case we only have two variables of interest, the concentrations of H2 and H+, both of which have some influence on the ORP. Therefore, to investigate the effects that just changing the variable H2 concentration has on the resulting ORP, we will experiment with different values for the H2 concentration while keeping the pH constant at 7. Later we will do the same to analyze the effects of H+ on ORP.
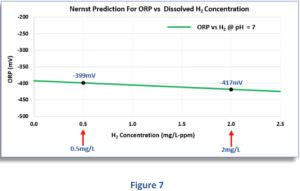
In Figure 7 we see the predicted ORP readings for a H2 concentration range typical of today's hydrogen-water machines, namely 0,5 to 2 mg/L. As the dissolved H2 concentration increases from 0,5 mg/L to 2 mg/L, the ORP response is very “flat,” falling from -399 mV to -417 mV, only 18 millivolts more negative! This means that every 2 mg/L change in H1 concentration (a large change in terms of potential therapeutic benefit) changes the ORP measurement by only 12 millivolts! To emphasize how small the influence of dissolved H2 on the ORP is, we can expand the H2 region of the graph by a large amount.
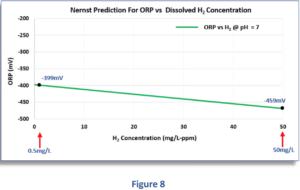
Figure 8 shows the negative ORP measurements for dissolved H2 concentrations in the range of 0,5 to 50 mg/l. As you can see, even within an extremely large range of 0,5 to 50 mg/L, the negative ORP increases from -399 mV to -459 mV, only 60 millivolts higher! However, although such a high dissolved H2 value could probably only be achieved under extreme laboratory conditions, this shows us how unresponsive the ORP is to even extremely large changes in H2 concentration.
Excerpt from the book by Randy Sharpe: “The relationship between dissolved H2, pH and redox potential”